Healthcare Supply Chain Optimization: The 10-Month Payback

Protect 2027 Operating Margins by
Unlocking Trapped Supply Capital with AI

Protect Your 2027 Margins by Unlocking Trapped Supply Chain Capital

See how a Large Southwestern U.S. Academic Medical Center reduced inventory by 50% and achieved a rapid cash-flow 10-month cash-flow payback with AI-powered automation.

Hospital supply chain spending (e.g., supplies, pharmaceuticals, purchased services) represents 30% – 40% of your total operating expenses. Discover how DARVIS partnered with a major academic medical center to unlock a 50% inventory footprint reduction and realize a full cash-flow payback in just 10 months. Let us help you co-author your 2027 fiscal margin protection strategy.

The 2027 Economic Reality

As you finalize clinical budgets and capital allocation models for 2027, your leadership team faces a familiar headwind. With clinical labor costs remaining largely inelastic, traditional back-office cost-cutting measures are no longer sufficient to expand or protect operating margins.

To thrive, healthcare systems must look to their second-largest line item: the supply chain.

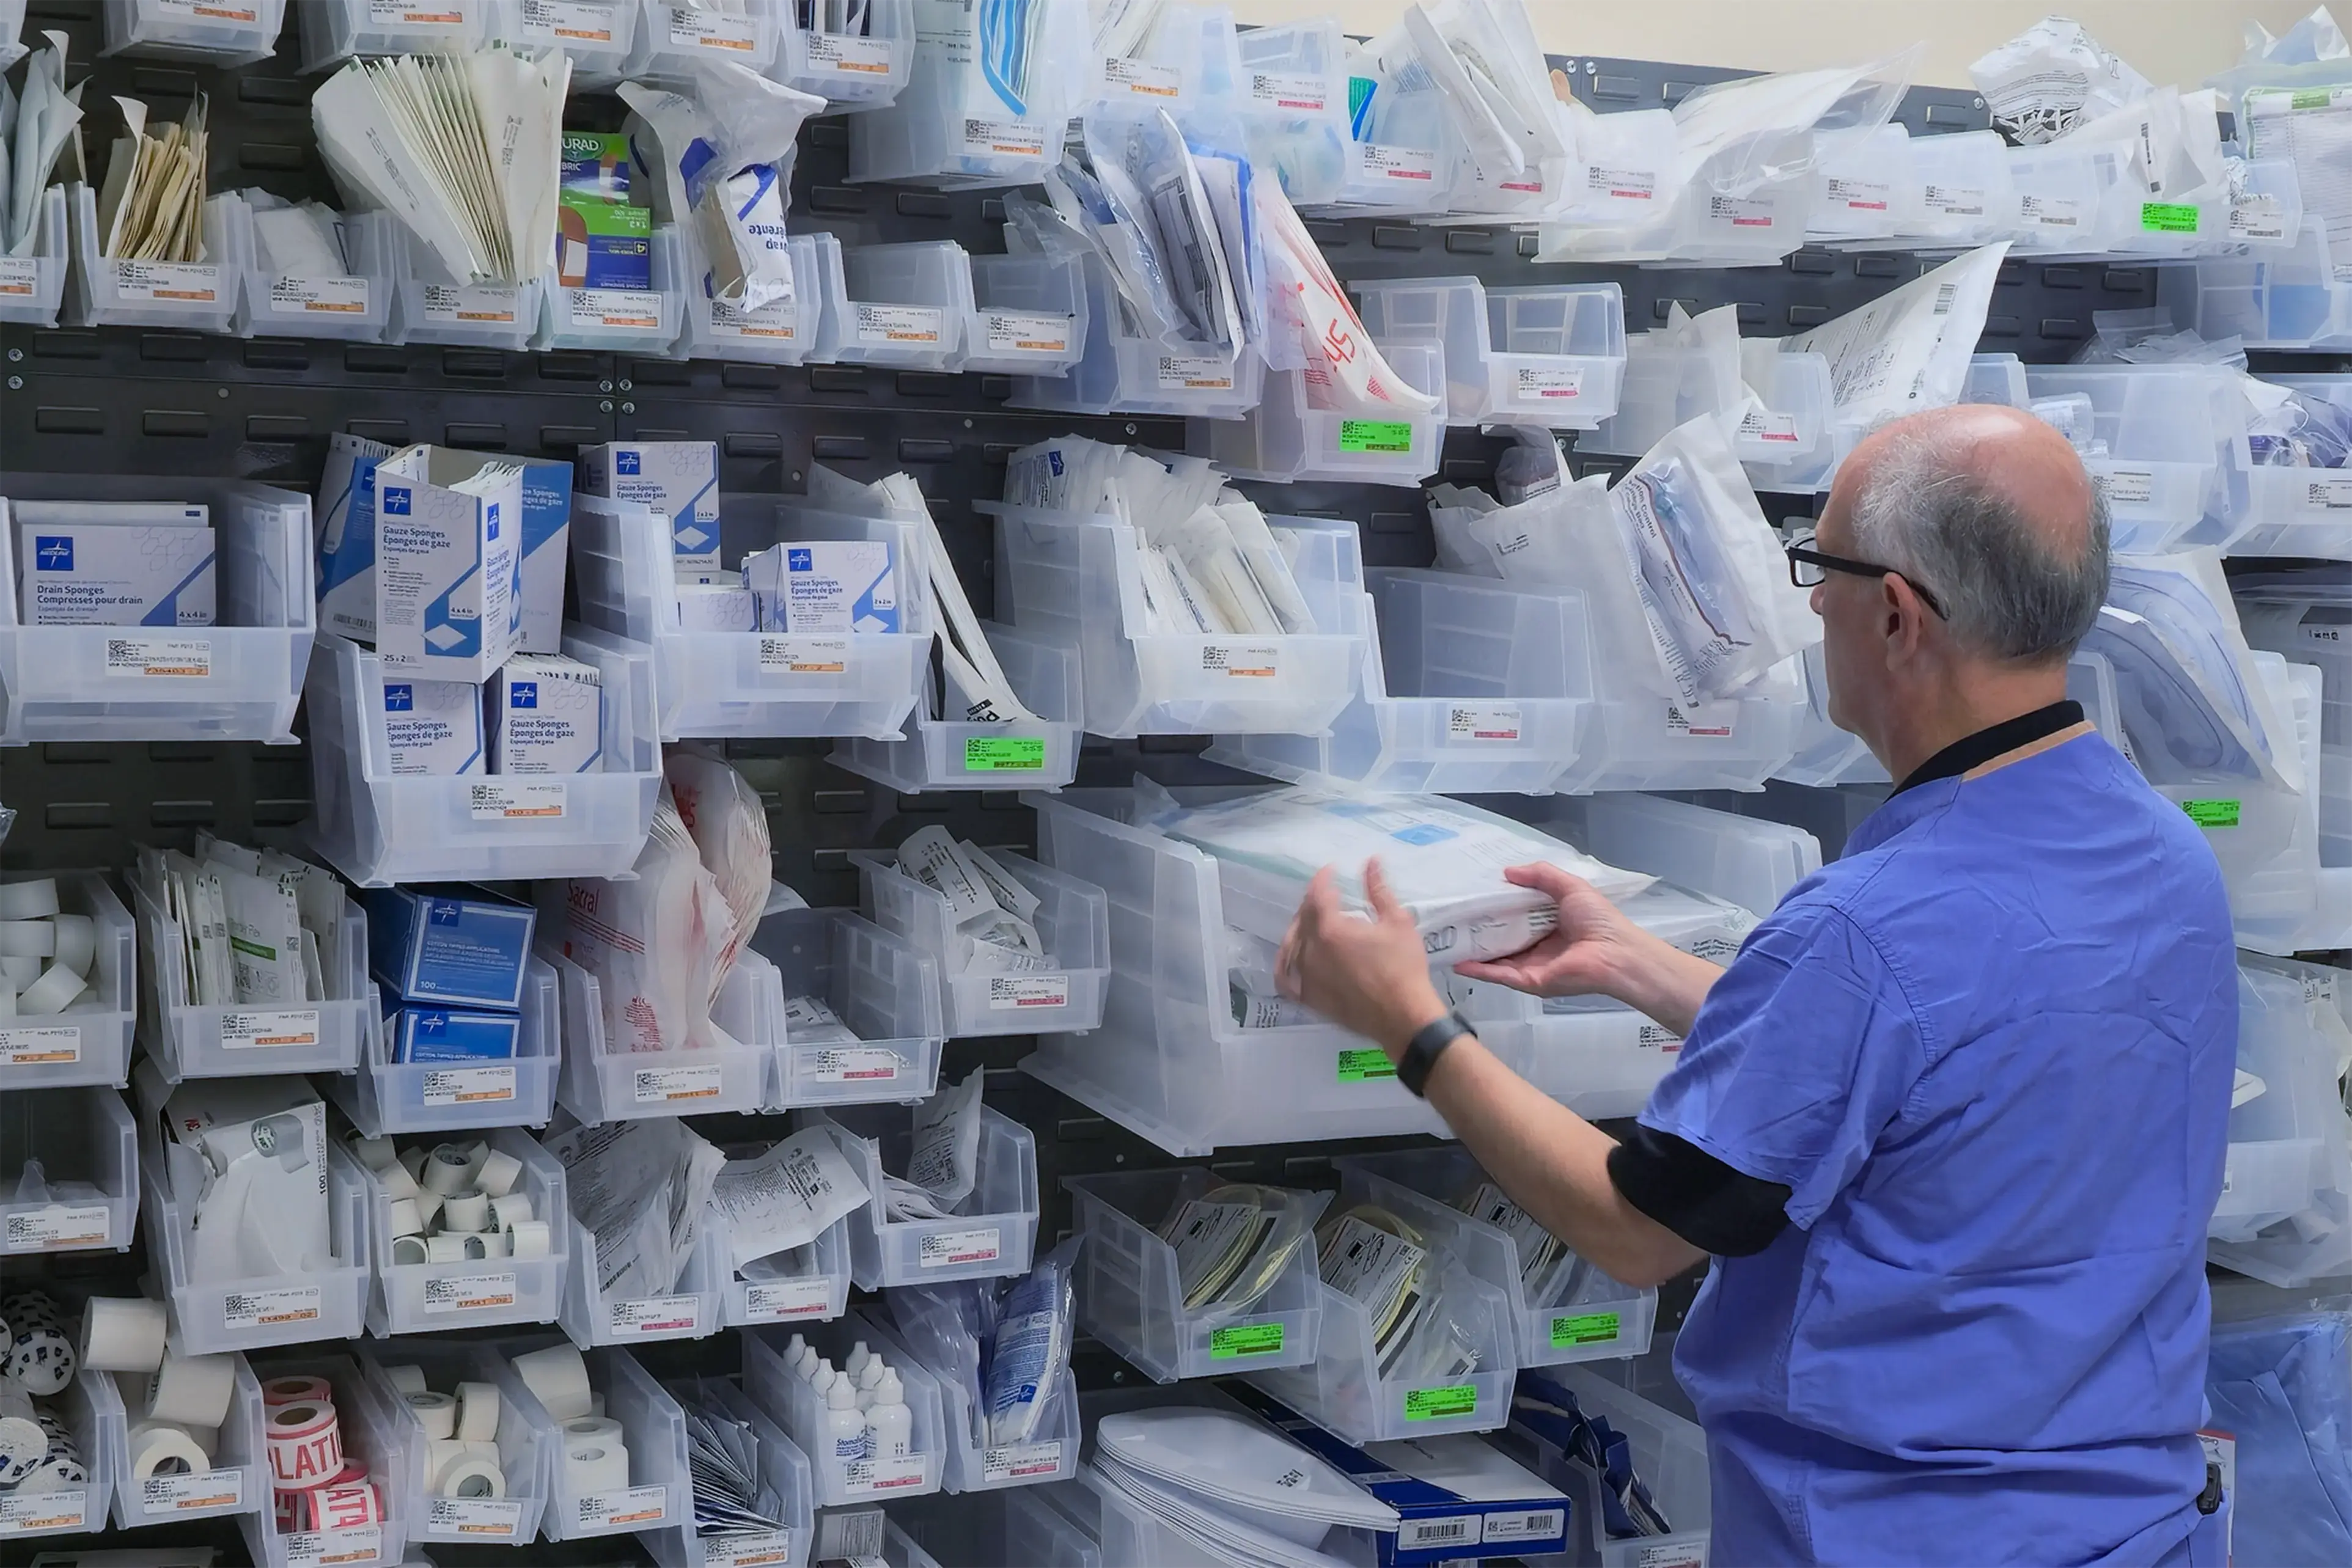
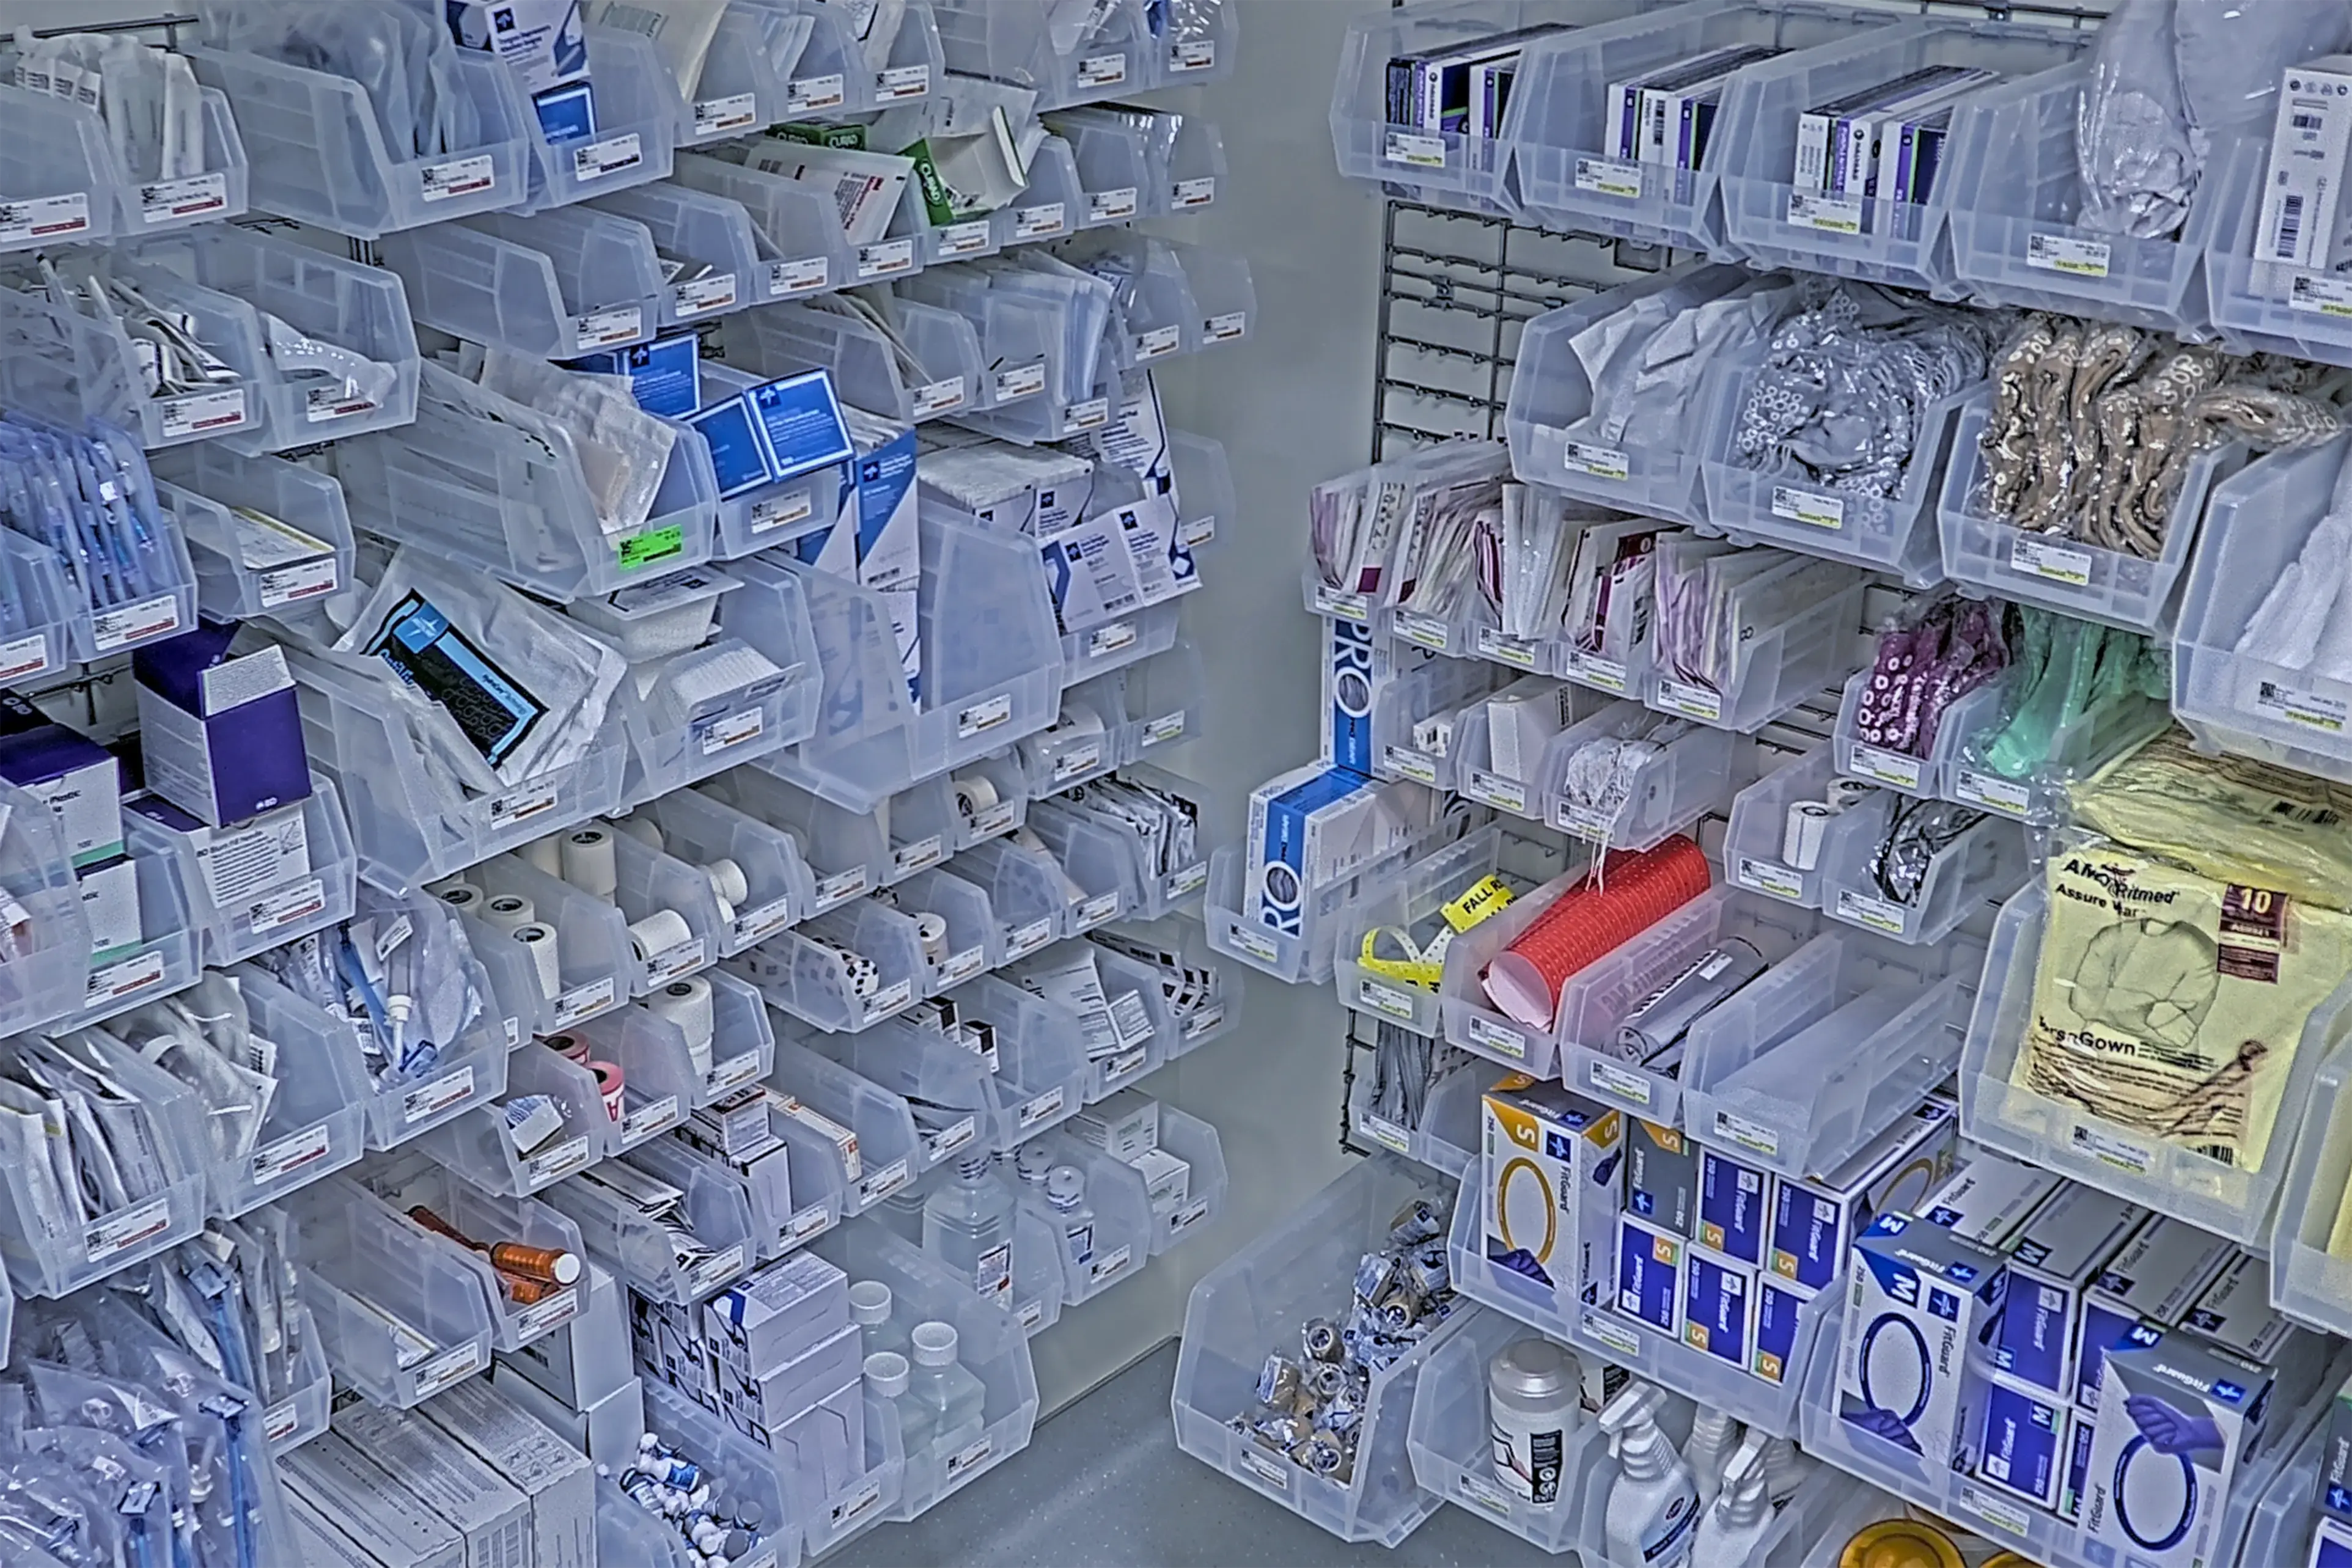
For decades, hospital systems operated on a "just-in-case" inventory model. This model unintentionally traps millions of dollars in storage rooms, overstocked par carts, and unrecorded shadow inventory. Together, we can transform this passive financial liability into active operational liquidity – without ever compromising patient care or clinical velocity.

A Proven Path to Positive ROI

A turnkey CapEx/OpEx structure delivering a verified 10-month runway to net-positive returns.

Frictionless Tech Integration

Native integration with Epic, Infor, and Oracle ERPs to supercharge your current tech stack without replacing it.

The Math of a 50% Reduction

Halving your physical inventory footprint does not mean rationing clinical supplies. Instead, it means using real-time computer vision to eliminate waste, prevent hoarding, and ensure that the right supplies are always exactly where they need to be. 

Business professionals discussing work
The Large Southwestern U.S. Academic Medical Center Milestone

A 50% reduction in inventory sounds unattainable – until you look at the data. 

DARVIS collaborated directly with a Large Southwestern U.S. Academic Medical Center to rationalize their complex, high-stakes clinical inventory ecosystem. By replacing manual tracking bottlenecks with autonomous AI logistics across expanding PAR locations, the partnership secured a 10-month, cash-flow-positive payback.

Yes, we were able to decrease stockouts as automation helped us catch 30% more orders than our manual approach while reducing headcount and increasing inventory turns from 6.5 to 12.

– Executive Director

Materials Management Systems & Support

The Results of the Partnership

Metric
Before DARVIS
After DARVIS
The Business Impact
Inventory Turns
6.5 turns
12 turns
Virtually doubled efficiency and reduced waste.
Manual Labor
100% manual baseline
33% reduction
Allowed clinical teams to prioritize patient care over paperwork.
Process Precision
Baseline accuracy
+7% improvement
Created immediate, measurable accuracy gains.

The 2027 Financial Model & Projected ROI

Based on a representative Integrated Delivery Network (IDN) deployment, this solution delivers a 74.5% Cumulative 5-Year ROI with a full payback achieved by Month 4. By automated tracking and optimizing workflows, organizations significantly reduce both manual waste and the capital tied up in stagnant stock.

50%

reduction in overall physical inventory footprint.

50%

reduction in capital baseline tied up in inventory.

50%

reduction in expired products and waste.

33%

reduction in manual labor hours.

10-15%

reduction in vendor-managed inventory.

7%

improvement in overall process accuracy.

Analysis & Financial Assumptions

To model these returns, we utilized a standard 5-year analysis horizon, using a 72-month cash-flow ledger, factoring in a 10.04% discount rate and a 22% corporate tax rate.

Scale & Coverage

Modeling is based on 1,012 total locations (887 PAR and 125 Perpetual), supported by 10 server pairs covering 250 locations each.

Inventory Value

Total baseline inventory value is modeled at $19.8M ($19.6K per location), with an annual procurement spend of $1M.

Shrinkage & Waste

Baseline shrinkage is calculated at 5% and baseline waste at 7%.

Total Investment

Total upfront capital outlay for cameras and servers is $3.8M.

Schedule a Personalized ROI Deep Dive Modeling Session

Every healthcare network has unique inventory dynamics, supply room shapes, and localized waste challenges. Because this model relies on strict financial rules – like localized tax rates and specific equipment deployment ratios – we recommend a brief, guided consultation. We will sit down with your team, input your exact location data, and build a custom cash-flow ledger tailored to your organization.